Demystifying Nigeria’s Conscious Attempt to Keep a Low Debt Profile as Debt Servicing Becomes Worrisome

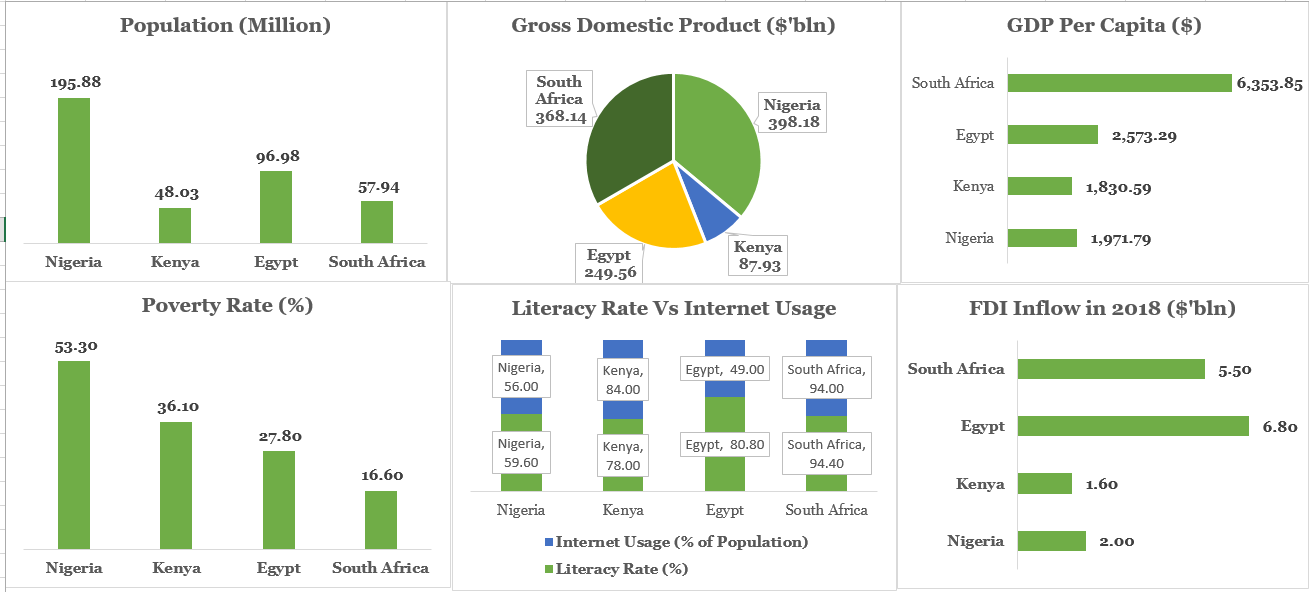
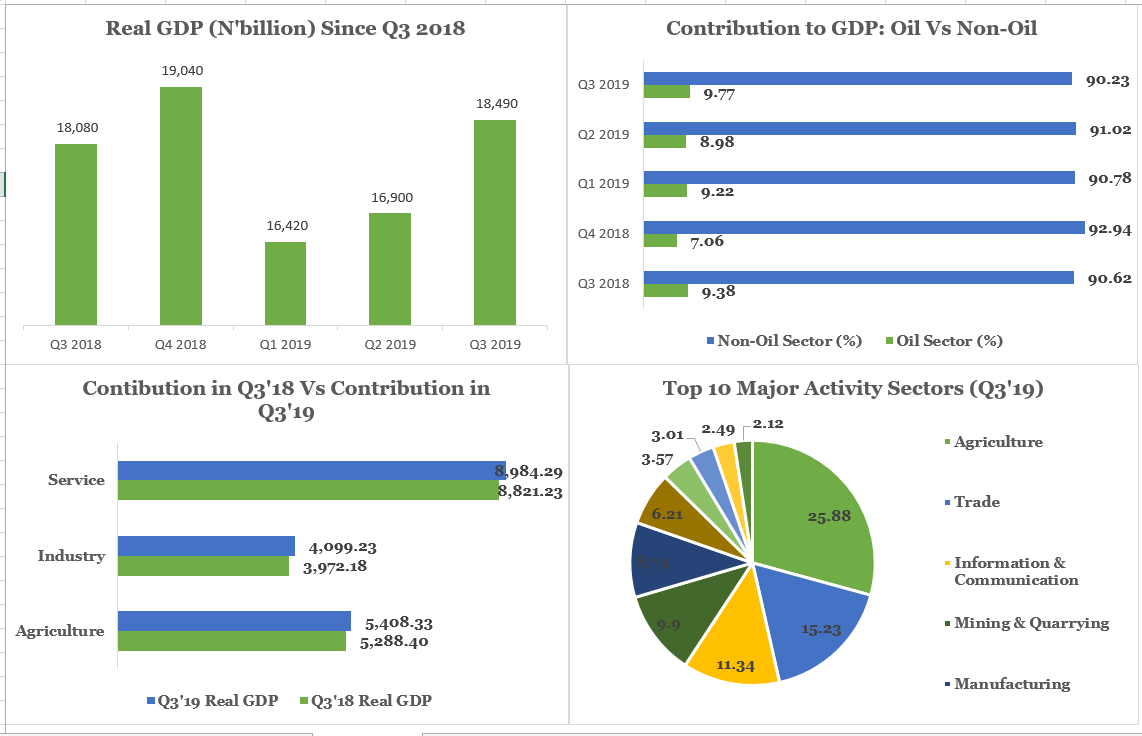
This research compares the Nigeria’s debt figures with global thresholds as well as with the key debt management framework of the Debt Management Office so as to know the debt path of the country going forward.

The FG Records N3.67 Trillion Deficit in the First 9 Months of 2019; Total Revenue at 48% of Total Expenditure

This analysis provides a look into the financial operations of the government in the first 9 months of 2019, as well as ranks the revenue sources to provide knowledge of the sources that contribute more to the entire gross revenue. The analysis therefore ends by providing more data on the monthly performance of the government in terms of revenue and expenditure.

Macroeconomic Analysis and Comparison of Some Selected Countries in Africa

With an estimation that over half of global population growth through 2050 will come from Africa (UN Estimates), the continent has the world’s fastest growing population. The continent is a 2.49 trillion dollars economy in terms of GDP (a total of 54 countries) and it houses around 1.2 billion people. The aim of this research is therefore to provide macroeconomic analysis of four countries (Nigeria, Kenya, Egypt and South Africa) given the fact that they constitute the largest markets of Financial Technology in Africa.

Q3 2019 GDP: Nigeria Records its Second Highest Quarterly Real Growth Rate Since 2016

Nominal and Real GDP Explained The GDP (a measure of the size of an economy) is the monetary value of all goods and services produced in a country during a given period of time and it can be calculated on either quarterly and/or annual basis. As an example, the monetary value of the rice sold […]

Significant Relationship among the Components of a Misery Index: The Nigerian Scenario

The misery index is a measure of how miserable the citizens of a country can be at a particular period of time. It is measured by evaluating the addition of Inflation Rate, Unemployment Rate and Lending rate, minus Year-On-Year growth in GDP per Capita. This shows that the higher the misery index, the more the […]

Scroll to top